Overview

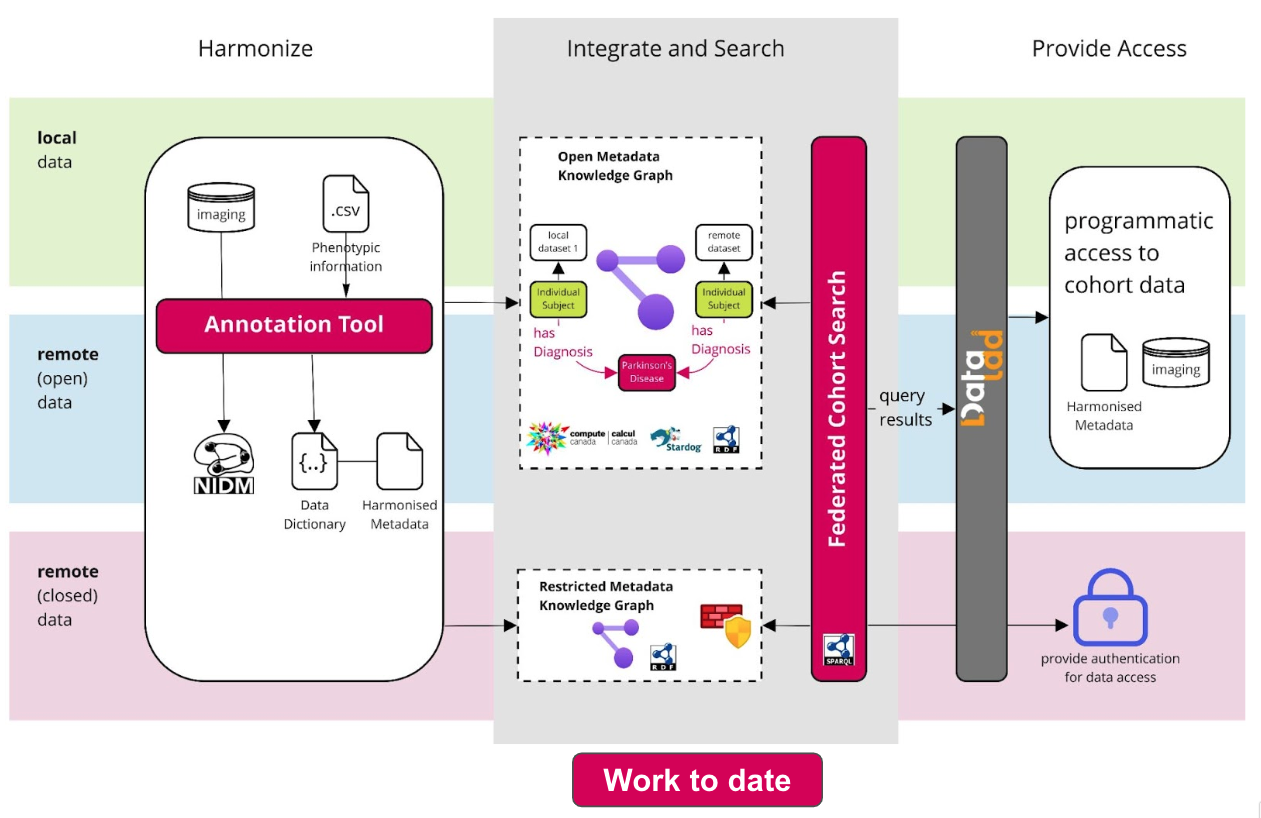
The goal of Neurobagel is to make describing and finding neuroimaging data easy. Searching across data that live on distributed storage systems is tricky, and the technologies that make it possible are not usually something researchers have experience with or time to learn.
We are building web-based, graphical user interfaces that make these steps easier:

  1. 1. Annotate and harmonize phenotypic data
  2. 2. Define and find subject-level cohorts across neuroimaging datasets

These tools are still in early development, but we are excited to share them with the neuroimaging community and are always looking for feedback.
Take a look at our github repositories and our roadmap below to get a sense of what we are doing at the moment!

Roadmap

Now

Local test deployment (single-session)

What gets done:

  • annotation tool produces graph-ready single-session data output
  • query interface and graph are locally deployable / deployed and talk to each other
  • we use annotation tool to annotate a local single-session dataset and feed it to the graph
  • imaging meta-data (BIDS) are extracted via pyBIDS and merged manually with phenotypic meta-data

What's the point

  • working prototye of the annotation tool (get feedback)
  • get real user feedback on the query interface and outputs

Local test deployment (multi-session)

What gets done

  • annotation tool can deal with several phenotypic files and multiple sessions, integrate information
  • query tool and data model understand multi-session data
  • we use our tools to annotate a second multi-session dataset and feed it to the graph

What's the point

  • have a minimally usable prototype locally running for users (search across datasets)
  • get user feedback on multi-session search workflow

Local test deployment (derivative data)

What gets done

  • annotation tool can integrate derivative information (simplified file format)
  • query interface allows searches for specific derivative protocol names
  • We use our tools to update data in the graph with derivative info

What's the point

  • first realistic prototype of our intended search experience for users
  • we got a good sense of how the annotation and upload process works
  • annotation tool is ready to be used by users

Next

Users annotate their own data (local deployment)

What gets done

  • detailed documentation of the annotation and graph upload process, data model
  • locally runnable python BIDS annotator (pyBIDS) is ready to go and documented
  • annotation tool is a web app (centrally deployed within institute)
  • new web app to handle merging of annotated meta-data and graph upload (basic auth)
  • users do the annotation and upload on their own (can add any data)

What's the point

  • first time the complete workflow is usable (realistic feedback on annotation)
  • adding datasets can be done by users, without input from us
  • first minimal process that can scale and be deployed at remote sites

Users annotate their own data (remote deployment)

What gets done

  • deployment of the stack of services (search, annotation, upload) is well documented
  • we help deploy it at a second site (Douglas)

What's the point

  • get feedback on how easy it is for an institution to run these tools on their hardware
  • get feedback from fully naive users (annotation) and on different data types

Later

Everything in the browser

What gets done

  • BIDS meta-data extraction is done inside the (a) web app

What's the point

  • user no longer needs to install and run local python tool, phenotypic and imaging meta-data are merged directly in the tool
  • we'll have a much easier time to find and resolve conflicts between imaging and phenotypic metadata early
  • workflow gets easier (fewer steps, fewer tools)
  • this can be deployed to the outside, allowing us to get wider feedback

Eventually

  • storing dataset access information via datalad
  • integrating query results with datalad, to allow users to programmatically gain access to results
  • exchanging data between siloed local deployments safely (file based, or smarter)
  • public deployment of the graph (open data) as a demo, reference, and target for other development
  • deeper representation of derivative data